Calculate skill of a MJO Index of S2S models as function of daily lead time#
# linting
%load_ext nb_black
%load_ext lab_black
import xarray as xr

xr.set_options(display_style="html")

import numpy as np
import matplotlib.pyplot as plt
from climpred import HindcastEnsemble
import climpred
Warning: ecCodes 2.21.0 or higher is recommended. You are running version 2.20.0
IRIDL hosts various subseasonal initialized forecast and hindcast simulations:
S2S project:http://iridl.ldeo.columbia.edu/SOURCES/.ECMWF/.S2S/
hindcast/reforecast: one variable, one model: ~ 80 GB
login required
SubX project:http://iridl.ldeo.columbia.edu/SOURCES/.Models/.SubX/
hindcast/reforecast: one variable, one model: ~ 100 GB
login not required
Here, we demonstrate how to set a cookie for IRIDL and access the skill of RMM1 subseasonal reforecasts.
Here are instructions for configuring xarray to open protected Data Library datasets, after you have created a Data Library account and accepted the terms and conditions for the dataset.
Visit https://iridl.ldeo.columbia.edu/auth/genkey . Log in to the Data Library. Copy the key from the response.
Create a file with the following content, substituting the key from step 1 for
"xxxx":Set-Cookie: __dlauth_id=xxxx; domain=.iridl.ldeo.columbia.eduPut the following in
~/.daprc, which is/home/jovyan/.daprcon renku, substituting the path to the above file for/path/to/cookie/file:HTTP.COOKIEJAR=/path/to/cookie/file. You may need to copy.daprcto/home/jovyanon renku, because/home/jovyanis not tracked bygit.
!cat ~/.daprc
HTTP.COOKIEJAR=/Users/aaron.spring/.cookie_iridl
#%writefile ~/.cookie_iridl
# Set-Cookie: __dlauth_id=xxxx; domain=.iridl.ldeo.columbia.edu
Get observations#
# pre-computed
obsds = climpred.tutorial.load_dataset("RMM-INTERANN-OBS")[
    "rmm1"
].to_dataset()  # only until 2017
obsds = obsds.dropna("time").sel(time=slice("1995", None))  # Get rid of missing times.
Get on-the-fly reforecasts#
S2S models:
ECMFECCCHMCRKMAUKMO
There are a set of reforecasts of the ECMWF model that match each real time forecast. They are made “on the fly” when a real time forecast is issued. So for S=0000 8 Feb 2021, there are reforecasts initialized on 0000 8 Feb 2020 and the 19 previous years on 8 Feb.
%%time
fcstds = xr.open_dataset(
    "https://iridl.ldeo.columbia.edu/SOURCES/.ECMWF/.S2S/.ECMF/.reforecast/.RMMS/.ensembles/.RMM1/dods",
    decode_times=False,
    chunks=None,
).compute()
CPU times: user 613 ms, sys: 1.06 s, total: 1.67 s
Wall time: 24.6 s
# calendar '360' not recognized, but '360_day'
if fcstds.hdate.attrs["calendar"] == "360":
    fcstds.hdate.attrs["calendar"] = "360_day"
The S2S data dimensions correspond to the following climpred dimension definitions: M=member, S=init. We will rename the dimensions to their climpred names.
# rename to match climpred dims: https://climpred.readthedocs.io/en/stable/setting-up-data.html
fcstds = fcstds.rename({"S": "init", "L": "lead", "M": "member", "RMM1": "rmm1"})
fcstds = xr.decode_cf(fcstds, use_cftime=True)
fcstds.coords
Coordinates:
  * hdate    (hdate) object 1995-07-01 00:00:00 ... 2020-07-01 00:00:00
  * init     (init) object 2015-05-14 00:00:00 ... 2021-02-15 00:00:00
  * member   (member) float32 0.0 1.0 2.0 3.0 4.0 5.0 6.0 7.0 8.0 9.0 10.0
  * lead     (lead) timedelta64[ns] 1 days 2 days 3 days ... 45 days 46 days
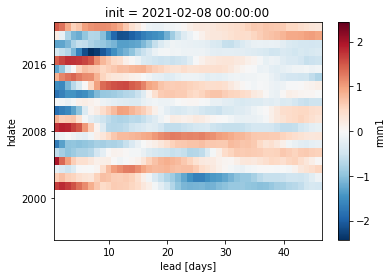
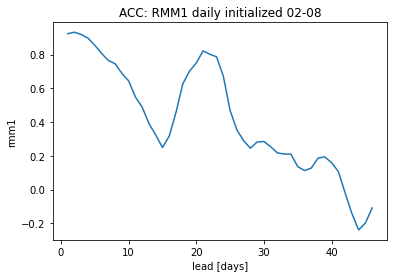
Skill for a single real-time forecast from corresponding reforecasts#
# assessing the skill of the reforecasts done annually from 8 Feb 2001 to 8 Feb 2020
# for the real-time forecast 8 Feb 2021
d = "08"
m = "02"
y = "2021"

fcstds.sel(init=f"{y}-{m}-{d}").squeeze().rmm1.mean("member").plot()
<matplotlib.collections.QuadMesh at 0x7ff84ebf9d90>
import cftime

# create a new init coordinate
new_init = xr.concat(
    [
        xr.DataArray(
            cftime.DatetimeProlepticGregorian(int(h.dt.year.values), int(m), int(d))
        )
        for h in fcstds.hdate
    ],
    "init",
)

# select new inits for same dayofyear, drop all NaNs
fcstds_date = (
    fcstds.sel(init=f"{y}-{m}-{d}", drop=True)
    .squeeze(drop=True)
    .assign_coords(hdate=new_init)
    .rename({"hdate": "init"})
    .dropna("init", how="all")
)
hindcast = HindcastEnsemble(fcstds_date)
hindcast = hindcast.add_observations(obsds)
%time skill = hindcast.verify(metric='acc', comparison='e2o', dim='init', alignment='maximize')
CPU times: user 1.8 s, sys: 24.5 ms, total: 1.82 s
Wall time: 1.99 s
skill.rmm1.plot()
plt.title(f"ACC: RMM1 daily initialized {m}-{d}")
Text(0.5, 1.0, 'ACC: RMM1 daily initialized 02-08')
skill over many initializations#
create large xr.DataArray with all hdate stacked into init
%%time
fcstds_dates = []
# loop over all inits, ignoring leap day
for s in fcstds.init:
    d = str(s.init.dt.day.values).zfill(2)
    m = str(s.init.dt.month.values).zfill(2)
    y = s.init.dt.year.values
    if d == "29" and m == "02":
        continue
    new_init = xr.concat(
        [
            xr.DataArray(
                cftime.DatetimeProlepticGregorian(int(h.dt.year.values), int(m), int(d))
            )
            for h in fcstds.hdate
        ],
        "init",
    )
    # select new inits for same dayofyear, drop all NaNs
    fcstds_date = (
        fcstds.sel(init=f"{y}-{m}-{d}", drop=True)
        .squeeze(drop=True)
        .assign_coords(hdate=new_init)
        .rename({"hdate": "init"})
        .dropna("init", how="all")
    )
    if fcstds_date.init.size > 0:  # not empty
        fcstds_dates.append(fcstds_date)

fcstds_dates = xr.concat(fcstds_dates, "init")

fcstds_dates = fcstds_dates.sortby(fcstds_dates.init)
CPU times: user 17.4 s, sys: 243 ms, total: 17.7 s
Wall time: 19.7 s
hindcast = HindcastEnsemble(fcstds_dates)
hindcast = hindcast.add_observations(obs_ds)
%time skill_all = hindcast.verify(metric='acc', comparison='e2o', dim='init', alignment='maximize')

skill_all.rmm1.plot()
CPU times: user 55.2 s, sys: 576 ms, total: 55.7 s
Wall time: 1min 1s
[<matplotlib.lines.Line2D at 0x7ff81c3af460>]
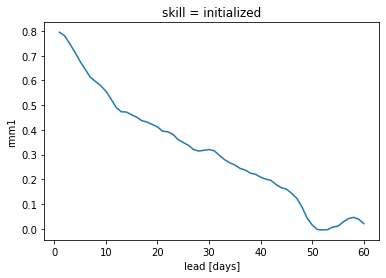
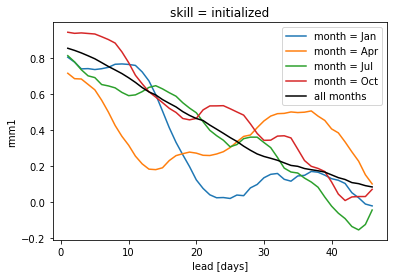
skill when initialized in different months#
import warnings

warnings.filterwarnings(
    "ignore"
)  # ignore climpred UserWarnings triggered by verification.sel(init)
%%time
for m in np.arange(1, 13, 3):
    hindcast_month = hindcast.sel(init=fcstds_dates.init.dt.month == m)
    month_name = hindcast_month.get_initialized().init[:2].to_index().strftime("%b")[0]
    skill = (
        hindcast_month.verify(metric="acc", comparison="e2o", dim="init", alignment="maximize")
    )
    skill.rmm1.plot(label=f"month = {month_name}")
skill_all.rmm1.plot(label='all months',c='k')
plt.legend()
CPU times: user 11.1 s, sys: 124 ms, total: 11.2 s
Wall time: 12.4 s
<matplotlib.legend.Legend at 0x7ff81beeb190>
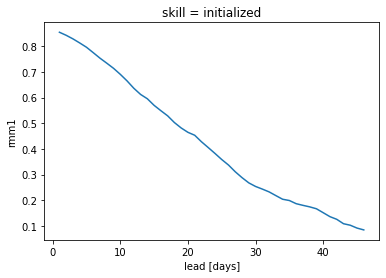
Get reforecasts without on-the-fly#
very similar workflow as in the SubX examples as there is no hdate coordinate: subseasonal SubX examples
S2S models:
CRNMCMABOMISACJMANCEP
%%time
fcstds = xr.open_dataset(
    "https://iridl.ldeo.columbia.edu/SOURCES/.ECMWF/.S2S/.CNRM/.reforecast/.RMMS/.ensembles/.RMM1/dods",
    decode_times=True,
).compute()

fcstds = fcstds.dropna("S", how="all")
CPU times: user 454 ms, sys: 804 ms, total: 1.26 s
Wall time: 21.2 s
# rename to match climpred dims: https://climpred.readthedocs.io/en/stable/setting-up-data.html
fcstds = fcstds.rename({"S": "init", "L": "lead", "M": "member", "RMM1": "rmm1"})
hindcast = HindcastEnsemble(fcstds)
hindcast = hindcast.add_observations(obsds)
%time skill = hindcast.verify(metric='acc', comparison='e2o', dim='init', alignment='maximize')
CPU times: user 54.3 s, sys: 688 ms, total: 55 s
Wall time: 1min 6s
skill.rmm1.plot()
[<matplotlib.lines.Line2D at 0x7ff81bdf5be0>]