You can run this notebook in a live session ![]() or view it on Github.
or view it on Github.
Bias Removal#
Climate models can have biases relative to different verification datasets. Commonly, biases are removed by postprocessing before verification of forecasting skill [Hawkins et al., 2016]. climpred provides convenience functions to do so.
The select from following methods by specifying how in HindcastEnsemble.remove_bias():
how="additive_mean": correcting the mean forecast additivelyhow="multiplicative_mean": correcting the mean forecast multiplicativelyhow="multiplicative_std": correcting the standard deviation multiplicatively
Wrapped from the github package bias_correction:
how="modified_quantile": Referencehow="basic_quantile": Referencehow="gamma_mapping": Referencehow="normal_mapping": Reference
Wrapped from xlim.sdba:
how="EmpiricalQuantileMapping":xclim.sdba.adjustment.EmpiricalQuantileMappinghow="DetrendedQuantileMapping":xclim.sdba.adjustment.DetrendedQuantileMappinghow="PrincipalComponents":xclim.sdba.adjustment.PrincipalComponentshow="QuantileDeltaMapping":xclim.sdba.adjustment.QuantileDeltaMappinghow="Scaling":xclim.sdba.adjustment.Scalinghow="LOCI":xclim.sdba.adjustment.LOCI
# linting
%load_ext nb_black
%load_ext lab_black
import climpred
import xarray as xr
import matplotlib.pyplot as plt
from climpred import HindcastEnsemble
initialized = climpred.tutorial.load_dataset("NMME_hindcast_Nino34_sst")
obs = climpred.tutorial.load_dataset("NMME_OIv2_Nino34_sst")
v = "sst"
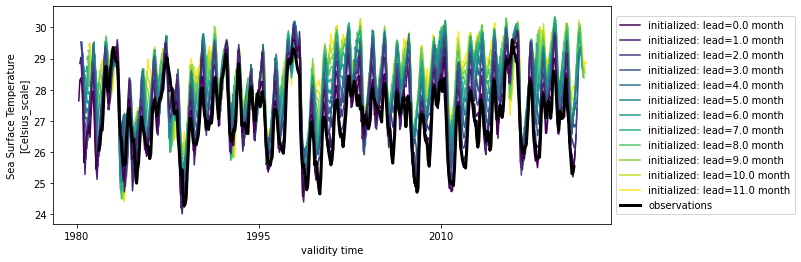
hindcast = HindcastEnsemble(
    initialized.sel(model="GFDL-CM2p5-FLOR-A06")
).add_observations(obs)
hindcast.plot()
/Users/aaron.spring/Coding/climpred/climpred/checks.py:202: UserWarning: Did not find dimension "init", but renamed dimension S with CF-complying standard_name "forecast_reference_time" to init.
  warnings.warn(
/Users/aaron.spring/Coding/climpred/climpred/checks.py:202: UserWarning: Did not find dimension "member", but renamed dimension M with CF-complying standard_name "realization" to member.
  warnings.warn(
/Users/aaron.spring/Coding/climpred/climpred/checks.py:202: UserWarning: Did not find dimension "lead", but renamed dimension L with CF-complying standard_name "forecast_period" to lead.
  warnings.warn(
<AxesSubplot:xlabel='validity time', ylabel='Sea Surface Temperature\n[Celsius_scale]'>
Additive mean bias removal#
Typically, bias depends on lead-time and therefore should therefore also be removed depending on lead.
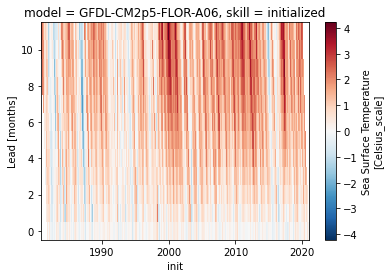
bias = hindcast.verify(
    metric="additive_bias", comparison="e2o", dim=[], alignment="same_verifs"
)

bias[v].plot()
<matplotlib.collections.QuadMesh at 0x143700d60>
# group bias by seasonality
seasonality = climpred.options.OPTIONS["seasonality"]
seasonality
'month'
bias.groupby(f"init.{seasonality}").mean()[v].plot()
<matplotlib.collections.QuadMesh at 0x1436fbd90>
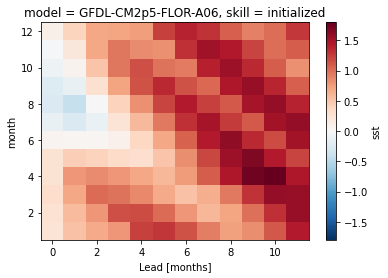
An initial warm bias develops into a cold bias, especially in winter.
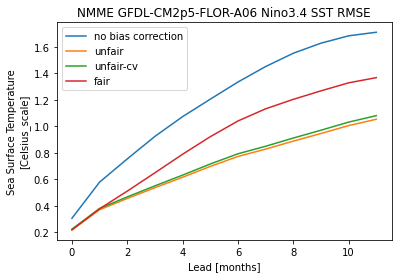
train_test_split#
Risbey et al. [2021] demonstrate how important a clean separation of a train and a test period is for bias reduction.
Implemented train_test_splits in climpred:
unfair: completely overlappingtrainandtest(climpred default)unfair-cv: overlappingtrainandtestexcept for currentinit, which is left out (setcv="LOO")fair: no overlap betweentrainandtest(recommended)
metric_kwargs = dict(
    metric="rmse", alignment="same_verifs", dim="init", comparison="e2o", skipna=True
)
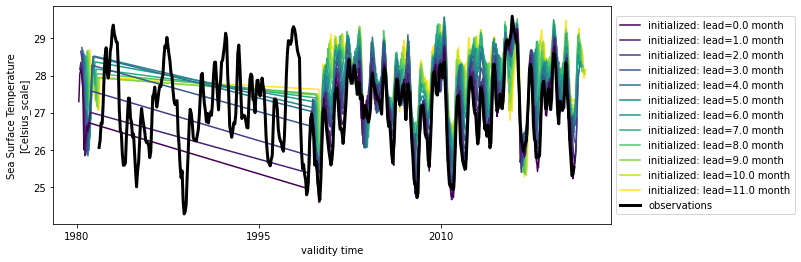
# fair calculates bias for train_time/train_init and drops these data from hindcast
hindcast.remove_bias(
    how="additive_mean",
    alignment=metric_kwargs["alignment"],
    train_test_split="fair",
    train_time=slice("1982", "1998"),
).plot()
<AxesSubplot:xlabel='validity time', ylabel='Sea Surface Temperature\n[Celsius_scale]'>
hindcast.verify(**metric_kwargs)[v].plot(label="no bias correction")
train_test_split = ["unfair", "unfair-cv", "fair"]

hindcast.remove_bias(
    how="additive_mean", alignment=metric_kwargs["alignment"], train_test_split="unfair"
).verify(**metric_kwargs)[v].plot(label="unfair")

hindcast.remove_bias(
    how="additive_mean",
    alignment=metric_kwargs["alignment"],
    train_test_split="unfair-cv",
    cv="LOO",
).verify(**metric_kwargs)[v].plot(label="unfair-cv")

hindcast.remove_bias(
    how="additive_mean",
    alignment=metric_kwargs["alignment"],
    train_test_split="fair",
    train_time=slice("1982", "1998"),
).verify(**metric_kwargs)[v].plot(label="fair")


plt.legend()
plt.title(
    f"NMME {hindcast.coords['model'].values} Nino3.4 SST {metric_kwargs['metric'].upper()}"
)
Text(0.5, 1.0, 'NMME GFDL-CM2p5-FLOR-A06 Nino3.4 SST RMSE')
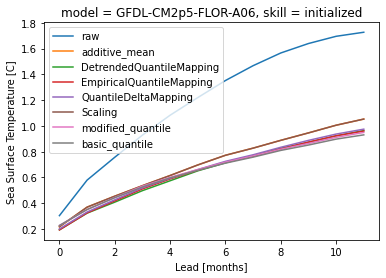
Comparison of methods how#
methods = [
    "additive_mean",
    # "multiplicative_std",
    "DetrendedQuantileMapping",
    "EmpiricalQuantileMapping",
    # "PrincipalComponents",
    # "LOCI",
    "QuantileDeltaMapping",
    "Scaling",
    "modified_quantile",
    "basic_quantile",
    # "gamma_mapping",
    # "normal_mapping",
]
import warnings

warnings.simplefilter("ignore")
# xclim.sdba requires pint units
hindcast._datasets["initialized"][v].attrs["units"] = "C"
hindcast._datasets["observations"][v].attrs["units"] = "C"
hindcast.sel(init=slice("1983", "2018")).verify(**metric_kwargs)[v].plot(label="raw")
for method in methods:
    hindcast.remove_bias(
        how=method, alignment=metric_kwargs["alignment"], train_test_split="unfair"
    ).verify(**metric_kwargs)[v].plot(label=method)
plt.legend()
<matplotlib.legend.Legend at 0x142093d60>
References#
Ed Hawkins, Steffen Tietsche, Jonathan J. Day, Nathanael Melia, Keith Haines, and Sarah Keeley. Aspects of designing and evaluating seasonal-to-interannual Arctic sea-ice prediction systems. Quarterly Journal of the Royal Meteorological Society, 142(695):672–683, January 2016. doi:10/gfb3pn.
James S. Risbey, Dougal T. Squire, Amanda S. Black, Timothy DelSole, Chiara Lepore, Richard J. Matear, Didier P. Monselesan, Thomas S. Moore, Doug Richardson, Andrew Schepen, Michael K. Tippett, and Carly R. Tozer. Standard assessments of climate forecast skill can be misleading. Nature Communications, 12(1):4346, July 2021. doi:10/gk8k7k.