Metrics
All high-level functions have an optional metric argument that can be called to determine which metric is used in computing predictability (potential predictability or prediction skill).
Note
We use the phrase ‘observations’ o here to refer to the ‘truth’ data to which
we compare the forecast f. These metrics can also be applied in reference
to a control simulation, reconstruction, observations, etc. This would just
change the resulting score from referencing skill to referencing potential
predictability.
Internally, all metric functions require forecast and reference as inputs. The dimension dim is set by compute_hindcast() or compute_perfect_model() to specify over which dimensions the metric is applied. See Comparisons.
Deterministic
Deterministic metrics quantify the level to which the forecast predicts the observations. These metrics are just a special case of probabilistic metrics where a value of 100% is assigned to the forecasted value [Jolliffe2011].
Core Metrics
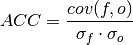
Pearson Anomaly Correlation Coefficient (ACC)
keyword: 'pearson_r', 'pr', 'pacc', 'acc'
A measure of the linear association between the forecast and observations that is independent of the mean and variance of the individual distributions [Jolliffe2011]. climpred uses the Pearson correlation coefficient.
Spearman Anomaly Correlation Coefficient (SACC)
keyword: 'spearman_r', 'sacc', 'sr'
A measure of how well the relationship between two variables can be described using a monotonic function.
-
climpred.metrics._spearman_r(forecast, reference, dim=None, **metric_kwargs)[source]¶ Spearman’s Anomaly Correlation Coefficient (SACC).

Note
Use metric
spearman_r_p_valueto get the corresponding pvalue.Parameters: - Range:
- perfect: 1
- min: -1
See also
- xskillscore.spearman_r
- xskillscore.spearman_r_p_value
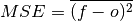
Mean Squared Error (MSE)
keyword: 'mse'
The average of the squared difference between forecasts and observations. This incorporates both the variance and bias of the estimator.
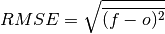
Root Mean Square Error (RMSE)
keyword: 'rmse'
The square root of the average of the squared differences between forecasts and observations [Jolliffe2011]. It puts a greater influence on large errors than small errors, which makes this a good choice if large errors are undesirable or one wants to be a more conservative forecaster.
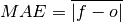
Mean Absolute Error (MAE)
keyword: 'mae'
The average of the absolute differences between forecasts and observations [Jolliffe2011]. A more robust measure of forecast accuracy than root mean square error or mean square error which is sensitive to large outlier forecast errors [EOS].
Median Absolute Deviation (MAD)
keyword: 'mad'
The median of the absolute differences between forecasts and observations.

Derived Metrics
Distance-based metrics like mse can be normalized to 1. The normalization factor depends on the comparison type choosen, eg. the distance between an ensemble member and the ensemble mean is half the distance of an ensemble member with other ensemble members. (see climpred.metrics._get_norm_factor()).
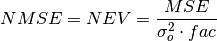
Normalized Mean Square Error (NMSE)
keyword: 'nmse','nev'
-
climpred.metrics._nmse(forecast, reference, dim=None, **metric_kwargs)[source]¶ Normalized MSE (NMSE) also known as Normalized Ensemble Variance (NEV).
Parameters: - forecast (*) –
- reference (*) –
- dim (*) – dimension to apply metric to
- comparison (*) – name comparison needed for normalization factor fac, see
climpred.metrics._get_norm_factor()(internally required to be added via **metric_kwargs) - metric_kwargs (*) – (optional) weights, skipna, see xskillscore.mse
- Range:
- 0: perfect forecast: 0
- 0 - 1: better than climatology forecast
- > 1: worse than climatology forecast
References
- Griffies, S. M., and K. Bryan. “A Predictability Study of Simulated North Atlantic Multidecadal Variability.” Climate Dynamics 13, no. 7–8 (August 1, 1997): 459–87. https://doi.org/10/ch4kc4.
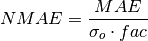
Normalized Mean Absolute Error (NMAE)
keyword: 'nmae'
-
climpred.metrics._nmae(forecast, reference, dim=None, **metric_kwargs)[source]¶ Normalized Ensemble Mean Absolute Error metric.
Parameters: - forecast (*) –
- reference (*) –
- dim (*) – dimension to apply metric to
- comparison (*) – name comparison needed for normalization factor fac, see
climpred.metrics._get_norm_factor()(internally required to be added via **metric_kwargs) - metric_kwargs (*) – (optional) weights, skipna, see xskillscore.mae
- Range:
- 0: perfect forecast: 0
- 0 - 1: better than climatology forecast
- > 1: worse than climatology forecast
References
- Griffies, S. M., and K. Bryan. “A Predictability Study of Simulated North Atlantic Multidecadal Variability.” Climate Dynamics 13, no. 7–8 (August 1, 1997): 459–87. https://doi.org/10/ch4kc4.
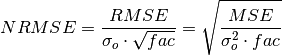
Normalized Root Mean Square Error (NRMSE)
keyword: 'nrmse'
-
climpred.metrics._nrmse(forecast, reference, dim=None, **metric_kwargs)[source]¶ Normalized Root Mean Square Error (NRMSE) metric.
Parameters: - forecast (*) –
- reference (*) –
- dim (*) – dimension to apply metric to
- comparison (*) – name comparison needed for normalization factor fac, see
climpred.metrics._get_norm_factor()(internally required to be added via **metric_kwargs) - metric_kwargs (*) – (optional) weights, skipna, see xskillscore.rmse
- Range:
- 0: perfect forecast
- 0 - 1: better than climatology forecast
- > 1: worse than climatology forecast
References
- Bushuk, Mitchell, Rym Msadek, Michael Winton, Gabriel Vecchi, Xiaosong Yang, Anthony Rosati, and Rich Gudgel. “Regional Arctic Sea–Ice Prediction: Potential versus Operational Seasonal Forecast Skill.” Climate Dynamics, June 9, 2018. https://doi.org/10/gd7hfq.
- Hawkins, Ed, Steffen Tietsche, Jonathan J. Day, Nathanael Melia, Keith Haines, and Sarah Keeley. “Aspects of Designing and Evaluating Seasonal-to-Interannual Arctic Sea-Ice Prediction Systems.” Quarterly Journal of the Royal Meteorological Society 142, no. 695 (January 1, 2016): 672–83. https://doi.org/10/gfb3pn.
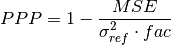
Mean Square Skill Score (MSSS)
keyword: 'msss','ppp'
-
climpred.metrics._ppp(forecast, reference, dim=None, **metric_kwargs)[source]¶ Prognostic Potential Predictability (PPP) metric.
Parameters: - forecast (xarray object) – forecast
- reference (xarray object) – reference
- dim (str) – dimension(s) to perform metric over. Automatically set by compute_.
- comparison (str) – name comparison needed for normalization factor fac,
climpred.metrics._get_norm_factor()(internally required to be added via **metric_kwargs) - metric_kwargs – (optional) weights, skipna, see xskillscore.mse
- Range:
- 1: perfect forecast
- positive: better than climatology forecast
- negative: worse than climatology forecast
References
- Griffies, S. M., and K. Bryan. “A Predictability Study of Simulated North Atlantic Multidecadal Variability.” Climate Dynamics 13, no. 7–8 (August 1, 1997): 459–87. https://doi.org/10/ch4kc4.
- Pohlmann, Holger, Michael Botzet, Mojib Latif, Andreas Roesch, Martin Wild, and Peter Tschuck. “Estimating the Decadal Predictability of a Coupled AOGCM.” Journal of Climate 17, no. 22 (November 1, 2004): 4463–72. https://doi.org/10/d2qf62.
- Bushuk, Mitchell, Rym Msadek, Michael Winton, Gabriel Vecchi, Xiaosong Yang, Anthony Rosati, and Rich Gudgel. “Regional Arctic Sea–Ice Prediction: Potential versus Operational Seasonal Forecast Skill. Climate Dynamics, June 9, 2018. https://doi.org/10/gd7hfq.
Mean Absolute Percentage Error (MAPE)
keyword: 'mape'
The mean of the absolute differences between forecasts and observations normalized by observations.
-
climpred.metrics._mape(forecast, reference, dim=None, **metric_kwargs)[source]¶ Mean Absolute Percentage Error (MAPE).

- Args:
forecast (xarray object): forecast reference (xarray object): reference dim (str): dimension(s) to perform metric over.
Automatically set by compute_.metric_kwargs: (optional) weights, skipna, see xskillscore.mape
- Range:
- perfect: 0
- min: 0
- max: ∞
- See also:
- xskillscore.mape
Symmetric Mean Absolute Percentage Error (sMAPE)
keyword: 'smape'
The mean of the absolute differences between forecasts and observations normalized by their sum.
-
climpred.metrics._smape(forecast, reference, dim=None, **metric_kwargs)[source]¶ symmetric Mean Absolute Percentage Error (sMAPE).

- Args:
forecast (xarray object): forecast reference (xarray object): reference dim (str): dimension(s) to perform metric over.
Automatically set by compute_.metric_kwargs: (optional) weights, skipna, see xskillscore.smape
- Range:
- perfect: 0
- min: 0
- max: 1
- See also:
- xskillscore.smape
Unbiased ACC
keyword: 'uacc'
-
climpred.metrics._uacc(forecast, reference, dim=None, **metric_kwargs)[source]¶ Bushuk’s unbiased ACC (uACC).

Parameters: - forecast (*) –
- reference (*) –
- dim (*) – dimension to apply metric to
- comparison (*) – name comparison needed for normalization factor fac, see
climpred.metrics._get_norm_factor()(internally required to be added via **metric_kwargs) - metric_kwargs (*) – (optional) weights, skipna, see xskillscore.mse
- Range:
- 1: perfect
- 0 - 1: better than climatology
References
- Bushuk, Mitchell, Rym Msadek, Michael Winton, Gabriel Vecchi, Xiaosong Yang, Anthony Rosati, and Rich Gudgel. “Regional Arctic Sea–Ice Prediction: Potential versus Operational Seasonal Forecast Skill. Climate Dynamics, June 9, 2018. https://doi.org/10/gd7hfq.
Murphy decomposition metrics
[Murphy1988] relates the MSSS with ACC and unconditional bias.
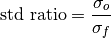
Standard Ratio
keyword: 'std_ratio'
Unconditional Bias
keyword: 'bias', 'unconditional_bias', 'u_b'

Bias Slope
keyword: 'bias_slope'

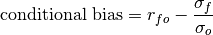
Conditional Bias
keyword: 'conditional_bias', c_b'
Murphy’s Mean Square Skill Score
keyword: 'msss_murphy'
-
climpred.metrics._msss_murphy(forecast, reference, dim=None, **metric_kwargs)[source]¶ Murphy’s Mean Square Skill Score (MSSS).
![MSSS_{Murphy} = r_{fo}^2 - [\text{conditional bias}]^2 - [\frac{\text{(unconditional) bias}}{\sigma_o}]^2](_images/math/b3a0cfaf148f6183b5a7d7bfa2e82643e8a9d2e6.png)
Parameters: References
- https://www-miklip.dkrz.de/about/murcss/
- Murphy, Allan H. “Skill Scores Based on the Mean Square Error and Their Relationships to the Correlation Coefficient.” Monthly Weather Review 116, no. 12 (December 1, 1988): 2417–24. https://doi.org/10/fc7mxd.
Probabilistic
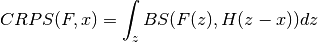
keyword: 'crps'
-
climpred.metrics._crps(forecast, reference, **metric_kwargs)[source]¶ Continuous Ranked Probability Score (CRPS) is the probabilistic MSE.
Parameters: - forecast (*) – forecast with member dim
- reference (*) – references without member dim
- metric_kwargs (*) – weights, see properscoring.crps_ensemble
- Range:
- perfect: 0
- min: 0
- max: ∞
References
- Matheson, James E., and Robert L. Winkler. “Scoring Rules for Continuous Probability Distributions.” Management Science 22, no. 10 (June 1, 1976): 1087–96. https://doi.org/10/cwwt4g.
See also
- properscoring.crps_ensemble
- xskillscore.crps_ensemble
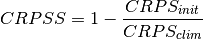
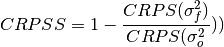
keyword: 'crpss'
-
climpred.metrics._crpss(forecast, reference, **metric_kwargs)[source]¶ Continuous Ranked Probability Skill Score
Note
When assuming a gaussian distribution of forecasts, use default gaussian=True. If not gaussian, you may specify the distribution type, xmin/xmax/tolerance for integration (see xskillscore.crps_quadrature).
Parameters: - forecast (*) – forecast with member dim
- reference (*) – references without member dim
- gaussian (*) – Assuming gaussian distribution for baseline skill. Default: True (optional)
- cdf_or_dist (*) – distribution to assume if not gaussian. default: scipy.stats.norm
- xmin, xmax, tol (*) – only relevant if not gaussian (see xskillscore.crps_quadrature)
- Range:
- perfect: 1
- pos: better than climatology forecast
- neg: worse than climatology forecast
References
- Matheson, James E., and Robert L. Winkler. “Scoring Rules for Continuous Probability Distributions.” Management Science 22, no. 10 (June 1, 1976): 1087–96. https://doi.org/10/cwwt4g.
- Gneiting, Tilmann, and Adrian E Raftery. “Strictly Proper Scoring Rules, Prediction, and Estimation.” Journal of the American Statistical Association 102, no. 477 (March 1, 2007): 359–78. https://doi.org/10/c6758w.
Example
>>> compute_perfect_model(ds, control, metric='crpss')
>>> compute_perfect_model(ds, control, metric='crpss', gaussian=False,
                          cdf_or_dist=scipy.stats.norm, xminimum=-10,
                          xmaximum=10, tol=1e-6)
See also
- properscoring.crps_ensemble
- xskillscore.crps_ensemble
keyword: 'crpss_es'
-
climpred.metrics._crpss_es(forecast, reference, **metric_kwargs)[source]¶ CRPSS Ensemble Spread.
Parameters: - forecast (*) – forecast with member dim
- reference (*) – references without member dim
- metric_kwargs (*) – weights, skipna used for mse
References
- Kadow, Christopher, Sebastian Illing, Oliver Kunst, Henning W. Rust, Holger Pohlmann, Wolfgang A. Müller, and Ulrich Cubasch. “Evaluation of Forecasts by Accuracy and Spread in the MiKlip Decadal Climate Prediction System.” Meteorologische Zeitschrift, December 21, 2016, 631–43. https://doi.org/10/f9jrhw.
- Range:
- perfect: 0
- else: negative
keyword: 'brier_score', 'brier', 'bs'
-
climpred.metrics._brier_score(forecast, reference, **metric_kwargs)[source]¶ Brier score for forecasts on binary reference.
- ..math:
- BS(f, o) = (f - o)^2
Parameters: - forecast (*) – forecast with member dim
- reference (*) – references without member dim
- func (*) – function to be applied to reference and forecasts and then mean(‘member’) to get forecasts and reference in interval [0,1]. (required to be added via **metric_kwargs)
- Reference:
- Brier, Glenn W. “VERIFICATION OF FORECASTS EXPRESSED IN TERMS OF
PROBABILITY.” Monthly Weather Review 78, no. 1 (1950). https://doi.org/10.1175/1520-0493(1950)078<0001:VOFEIT>2.0.CO;2.
Example
>>> def pos(x): return x > 0
>>> compute_perfect_model(ds, control, metric='brier_score', func=pos)
See also
- properscoring.brier_score
- xskillscore.brier_score
keyword: 'threshold_brier_score', 'tbs'
-
climpred.metrics._threshold_brier_score(forecast, reference, **metric_kwargs)[source]¶ Brier scores of an ensemble for exceeding given thresholds. Provide threshold via metric_kwargs.
- Range:
- perfect: 0
- min: 0
- max: 1
Parameters: - forecast (*) – forecast with member dim
- reference (*) – references without member dim
- threshold (*) – Threshold to check exceedance, see properscoring.threshold_brier_score (required to be added via **metric_kwargs)
References
- Brier, Glenn W. “VERIFICATION OF FORECASTS EXPRESSED IN TERMS OF
PROBABILITY.” Monthly Weather Review 78, no. 1 (1950). https://doi.org/10.1175/1520-0493(1950)078<0001:VOFEIT>2.0.CO;2.
Example
>>> compute_perfect_model(ds, control,
                          metric='threshold_brier_score', threshold=.5)
See also
- properscoring.threshold_brier_score
- xskillscore.threshold_brier_score
User-defined metrics
You can also construct your own metrics via the climpred.metrics.Metric class.
Metric(name, function, positive, …[, …]) |
Master class for all metrics. |
First, write your own metric function, similar to the existing ones with required arguments forecast, reference, dim=None, and **metric_kwargs:
from climpred.metrics import Metric

def _my_msle(forecast, reference, dim=None, **metric_kwargs):
    """Mean squared logarithmic error (MSLE).
    https://peltarion.com/knowledge-center/documentation/modeling-view/build-an-ai-model/loss-functions/mean-squared-logarithmic-error."""
    return ( (np.log(forecast + 1) + np.log(reference + 1) ) ** 2).mean(dim)
Then initialize this metric function with climpred.metrics.Metric:
_my_msle = Metric(
    name='my_msle',
    function=_my_msle,
    probabilistic=False,
    positive=False,
    unit_power=0,
    )
Finally, compute skill based on your own metric:
skill = compute_perfect_model(ds, control, metric='rmse', comparison=_my_msle)
Once you come up with an useful metric for your problem, consider contributing this metric to climpred, so all users can benefit from your metric, see contributing.
References
| [EOS] | https://eos.org/opinions/climate-and-other-models-may-be-more-accurate-than-reported |
| [Jolliffe2011] | (1, 2, 3, 4) Ian T. Jolliffe and David B. Stephenson. Forecast Verification: A Practitioner’s Guide in Atmospheric Science. John Wiley & Sons, Ltd, Chichester, UK, December 2011. ISBN 978-1-119-96000-3 978-0-470-66071-3. URL: http://doi.wiley.com/10.1002/9781119960003. |
| [Murphy1988] | Allan H. Murphy. Skill Scores Based on the Mean Square Error and Their Relationships to the Correlation Coefficient. Monthly Weather Review, 116(12):2417–2424, December 1988. https://doi.org/10/fc7mxd. |